Step Up SIP Calculator with Table – A Smarter Way to Plan Your Investments
Investing has evolved beyond just dumping a lump sum or sticking to old-school savings. These days, more people are opting for Systematic Investment Plans (SIPs), where you put in smaller amounts regularly into mutual funds. While standard SIPs are great, there’s a more flexible option that’s catching on: the Step Up SIP.
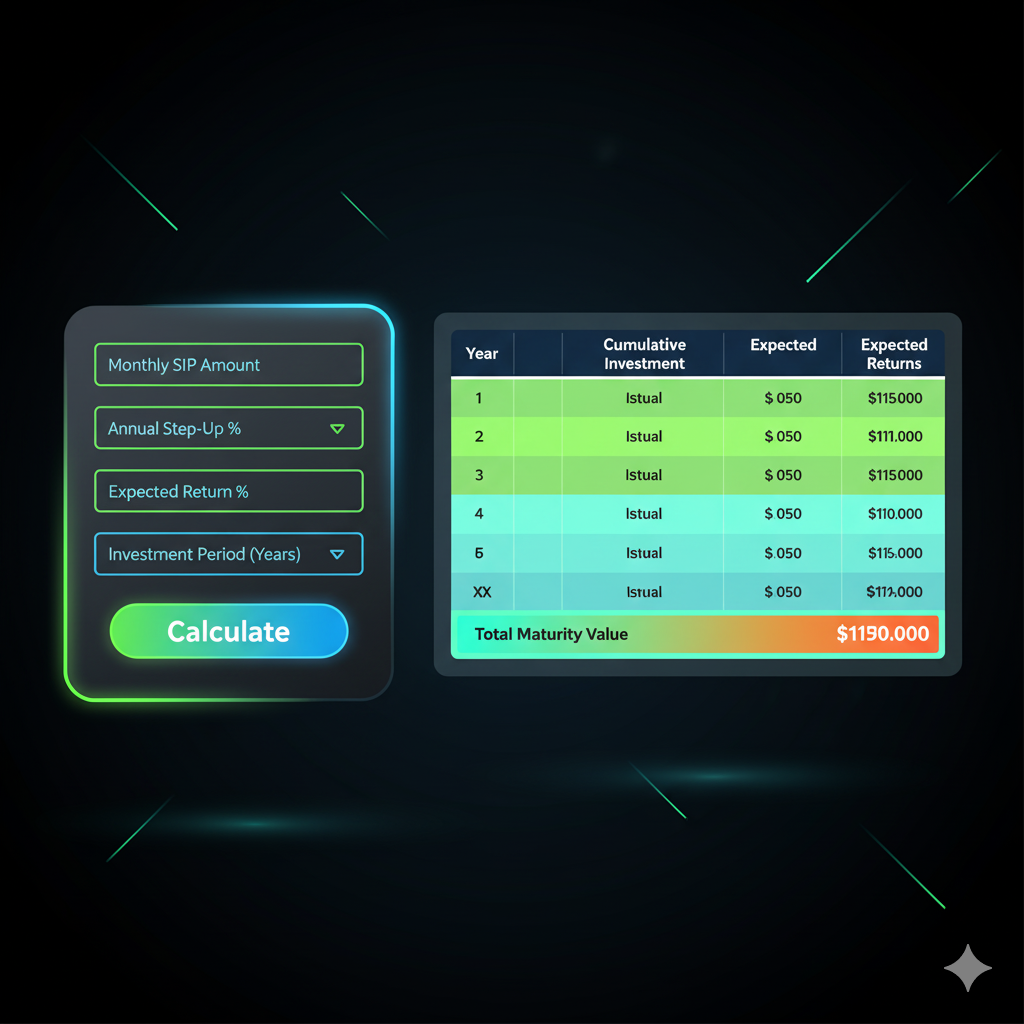
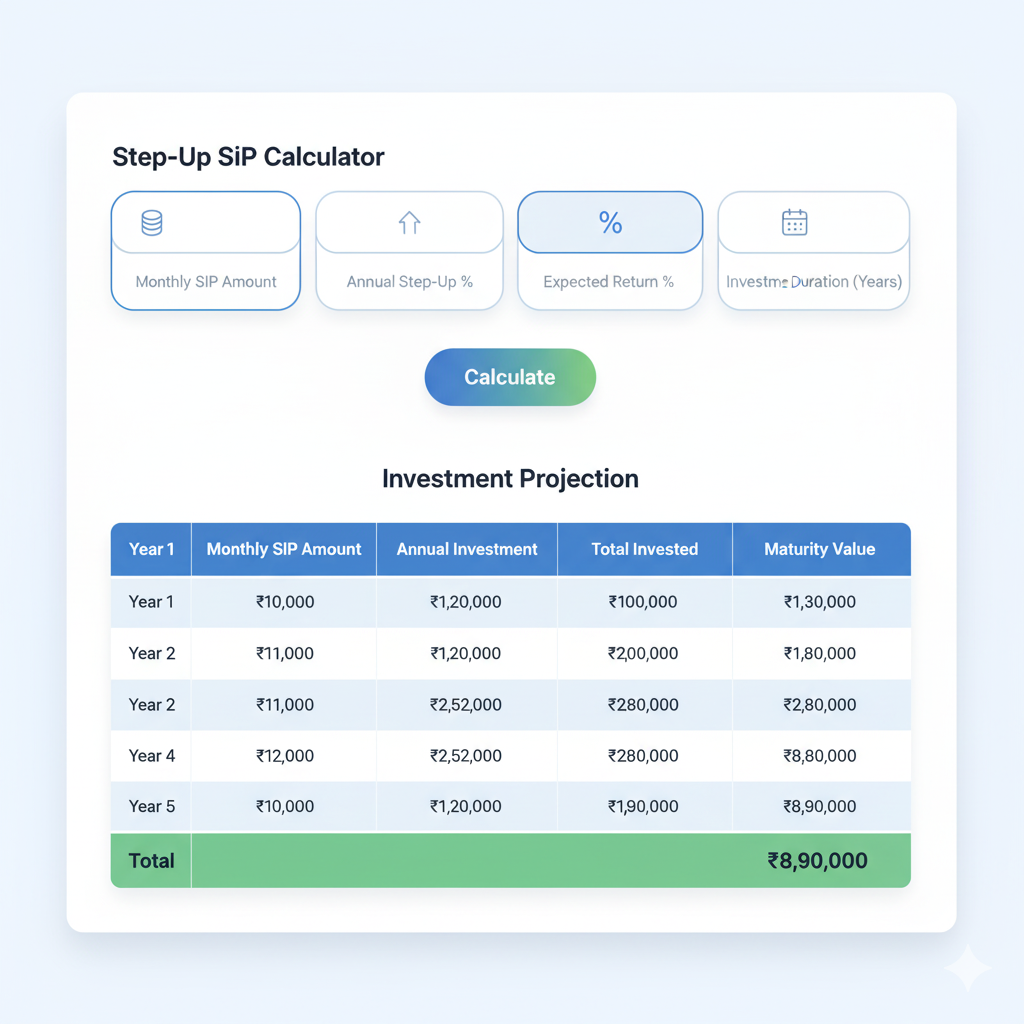
AStep Up SIP Calculator with Table is a handy tool that not only crunches the numbers on potential returns but also shows how bumping up your contributions over time can supercharge your wealth-building. The table gives you a straightforward, year-by-year view of how your investments grow, making planning feel more real and doable.
Understanding the Step Up SIP Calculator with Table Concept
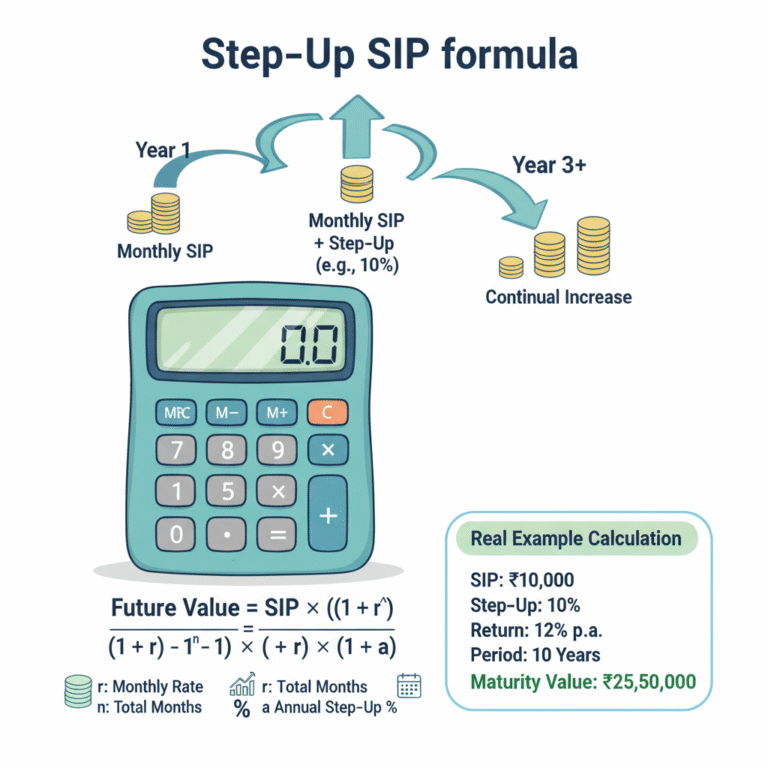
In a regular SIP, your monthly investment stays the same the whole time. It’s disciplined, sure, but it doesn’t account for how your income often goes up each year. A step-up SIP fixes that by letting you increase your contributions periodically—typically annually.
For instance, start with ₹5,000 a month and a 10% yearly step-up. That means ₹5,500 in year two, ₹6,050 in year three, and so on. Over the long haul, these gradual increases can build a much bigger nest egg than a flat SIP.
The step-up SIP calculator with a table lays this out plainly. Instead of just spitting out a final number, it breaks it down year by year, showing investments, growth, and what you might end up with.
Why Investors Prefer Step Up SIPs
Life changes—salaries go up, costs rise, and your goals shift. A fixed SIP might not cut it for big dreams, especially with inflation eating away at your money’s value. Step-up SIPs keep things in sync with your growing income and future needs.
The calculator simplifies this by letting you plug in your starting amount, step-up percentage, how long you’ll invest, and expected returns. It then shows a full table of how things play out, so you can tweak and see different outcomes.
That’s why so many folks turn to a SIP step-up calculator with a table before diving in—it makes the decision feel informed and less overwhelming.
Features of a Step Up SIP Calculator with Table
What sets this calculator apart is the table view. Basic ones just give you the end result, but this one dives deeper with:
- Year-by-year SIP contributions.
- How monthly and annual investments increase over time.
- Projected corpus growth through compounding.
- A comparison of regular SIPs versus step-up ones.
It’s a practical gem for anyone serious about long-term planning who wants everything laid out clearly.
Example of Step Up SIP Calculator with Table
Let’s walk through a real-world example to see how a step-up SIP calculator with a table works.
Say you start with ₹5,000 monthly, step up by 10% each year, for 10 years, expecting 12% returns.
Here’s a sample of how it might look:
| Year | Monthly SIP (₹) | Annual Contribution (₹) | Estimated Value at Year-End (₹) |
| 1 | 5,000 | 60,000 | 67,200 |
| 2 | 5,500 | 66,000 | 1,52,800 |
| 3 | 6,050 | 72,600 | 2,58,900 |
| 4 | 6,655 | 79,860 | 3,88,500 |
| 5 | 7,320 | 87,840 | 5,44,700 |
| 6 | 8,052 | 96,624 | 7,31,500 |
| 7 | 8,857 | 1,06,284 | 9,52,200 |
| 8 | 9,742 | 1,16,904 | 12,10,800 |
| 9 | 10,716 | 1,28,592 | 15,12,000 |
| 10 | 11,788 | 1,41,456 | 18,61,000 |
This table really highlights how your investments build up with those step-ups, compared to keeping things flat.
Benefits of Using Step Up SIP Calculator with Table
The table format brings real transparency—you see exactly how things unfold each year, not just the big finale.
Key perks include:
- Straightforward comparison between flat and step-up SIPs.
- Better grasp of how compounding works its magic.
- Seeing how little boosts add up to big gains.
- Extra motivation to keep increasing those contributions.
With a SIP calculator featuring a table, you can monitor your path to goals and tweak plans as life happens.
The Role of Inflation in SIP Planning
Inflation sneaks up and makes everything more expensive over time, so your investments need to keep pace. A step-up SIP does that by growing your contributions alongside rising costs.
Using the step-up SIP calculator with a table, you can model scenarios that factor in inflation, giving you a more accurate picture of what you’ll need for things like education, retirement, or buying a home.
Regular SIP vs Step Up SIP Calculator with Table Comparison
To show the difference, imagine a flat ₹5,000 SIP for 10 years at 12% returns. You’d invest ₹6,00,000 total and end up with about ₹11,60,000.
But with a 10% annual step-up (like in the earlier table), your total investment goes up a bit, but the final amount jumps to around ₹18,60,000.
A step-up SIP return calculator with a table makes this gap crystal clear, underscoring why stepping up can be a game-changer.
Why Tables Improve Financial Planning
Visuals make numbers click. A step-up SIP calculator with a table doesn’t just compute—it organizes the info so you can follow yearly contributions and growth easily.
For advisors, it’s a great way to break down ideas for clients who might glaze over at raw math.
SBI and Other Platforms Offering Step Up SIP Calculator with Table
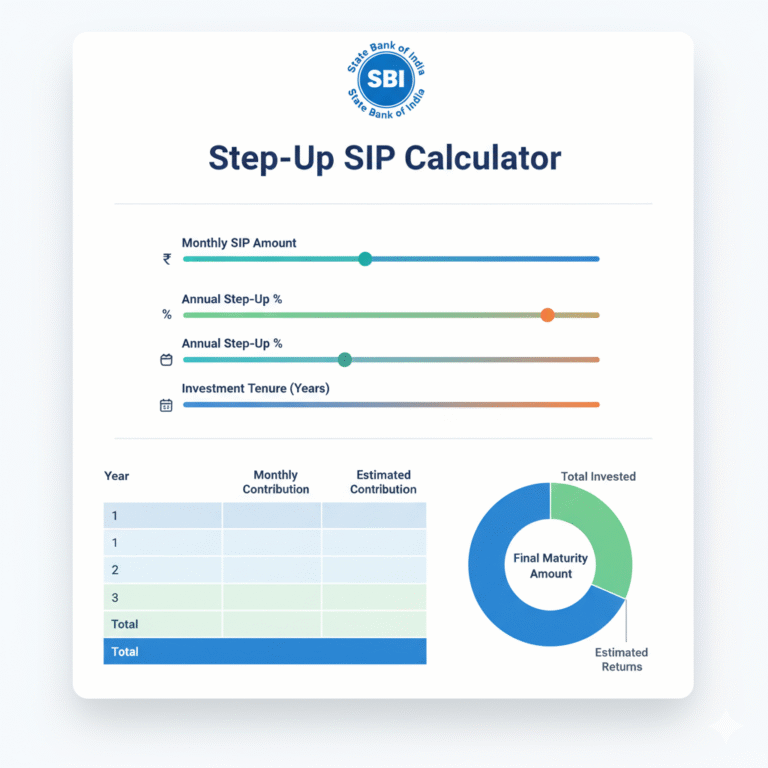
Banks like SBI and various mutual fund sites offer SIP calculators with step-up features and tables. They’re usually free and online, so you can play around with different step-up rates and timelines anytime.
The SBI step up SIP calculator with table is a favorite since it ties right into their mutual fund options, letting you plan and invest all in one spot.
Psychological Benefit of Step Up SIP Calculator with Table Strategy
Starting a high SIP can feel daunting if your budget’s tight. Step-up SIPs ease you in with smaller amounts that grow as your income does.
Seeing those increases in a table format builds confidence—it’s tangible proof of progress, keeping you motivated.
FAQs on Step Up SIP Calculator with Table
Final Thoughts
Good financial planning boils down to sticking with it and adapting as needed. A step-up SIP calculator with a table nails both by helping you forecast wealth while matching contributions to income growth and inflation.
It gives you that year-by-year insight, making it simpler to stay on track, avoid skimping, and hit goals like retirement or building wealth.
No matter if you’re new to this or have been at it for years, adding step-up SIPs and using a table-based calculator can really level up your planning.


